The flow of energy through an ecosystem is called ecological energetic. Energy is the ability to do some work. The sun emits light and other types of radiation. Some of these radiations fall on the earth. The light radiation falls on some object. The Object absorbs light and become warm. Thus light energy is transferred into heat energy. Land and oceans absorb heat. It produces heat and cold areas on the earth. It causes flow of air and clouds.
The source of energy on the earth is the sun. A small amount of the radiant energy is absorbed by the green plants. They change this energy into chemical energy in the form of glucose. All the other living organisms obtain this chemical energy from the plants. A large amount of energy is lost in the form of heat.
Only a small part of the solar radiation is used during photosynthesis. This stored energy provides energy to living components of the ecosystem. Green plants absorb blue and red part of the spectrum. However, only I to 5% of the absorbed energy is converted into food energy. The energy used once by an organism is soon lost in the form of heat. There is always one way flow of energy. The flow of energy through ecosystem follows laws of thermodynamics.
It has been estimated that about 57% of the solar energy is absorbed in atmosphere. It is scattered in space. About 36% is absorbed by water or land. About 8% falls on plants. 80 to 85% is absorbed by green plants and rest of it is reflected. About 50% of the absorbed energy is used in photosynthesis i.e. it is stored in the form of potential energy of organic compounds of green plants.
The bioenergetics is discuss under three headings; (a) Productivity of ecosystem, (b) Food chain, Trophic levels and food web and (c) Ecological pyramids
(a) Productivity of an Ecosystem
The rate at which food is manufactured by the producers in unit area and in unit time is called productivity. There are following types of productivity:
- Primary Productivity
The rate at which solar energy is converted into organic energy by green plants or total food assimilation rate of producers is called primary productivity. Primary productivity can be measured in grams of carbohydrate produced per unit of land surface per year. Primary productivity is of two types
(a) Gross primary productivity: The total rate of photosynthesis or the total amount of organic matter fixed is called gross primary productivity. It also includes the organic matter used up in plant respiration.
(b)Net primary productivity: The organic matter stored in plant
- tissues is called net primary productivity. The organic matter used up in the process of respiration is excluded from it. It is the food available to the consumers. •
Relationship between the two types of productivity may well be understood by the following simple equations
Gross primary productivity = Photosynthesis 4- Respiration
Net primary productivity = Gross primary productivity—Respiration
- Secondary productivity
The amount of energy available •to other trophic level i.e. the heterotrophs or the consumers is called secondary Productivity.
(b) Food chain, Trophic levels and food web FOOD CHAIN
The sequence of organisms through which energy moves in an ecosystem is called food chain. For example. plants are eaten by herbivores. The herbivores are eaten by carnivores. Thus the food manufactured by plants travel from producers to herbivores and herbivores to carnivores. Food chain has following types
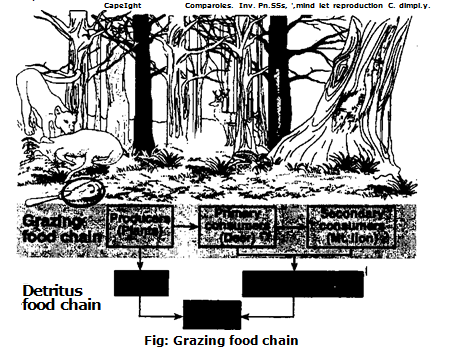
I. Grazing Food Chain: It is found in the terrestrial ecosystem or fresh water ecosystem. It has a plant or photosynthetic algae at the base. It goes from smaller to larger animals.
- Grassland: The food chain of grazing ecosystem consists of grasses. grasshopper. frog, snake and owl.
- Open forest: Food chain of open ecosystem consists of trees. deer and lion.Fresh water
- ecosystem: The food chain of fresh water ecosystem consists of algae, water fleas, small fish, large fish and a fish eating animal, bird or man.
2. Parasitic Food Chain: It goes from large to smaller organism. In this case, parasites of different types are involved. Large varieties ol fungi. bacteria and other parasites obtain food from their host. The host ma v he animal or plants
3. Saprophytic or Detritus Food Chain: It is a type of food chain in which decomposers like fungi and bacteria attack dead remains of plants and animals to obtain food.
TROPHIC LEVEL
Each level in the food chain in a natural community is Called as trophic level. There are different trophic levels:
I. First trophic level: The green plants occupy the first trophic level (the primary producer level )
- Second trophic level: Plant eaters (herbivores) form the second level or primary consumer lewd
- Third trophic level: Carnivores that eat the herbivores form the third level or secondary consumer level
- Fourth trophic level: Fourth level is composed of tertiary consumer.
- Some animals can eat plants as well as smaller animals. Therefore, they are called as Omnivores. Thus it occupies more than one trophic level in the food chain.
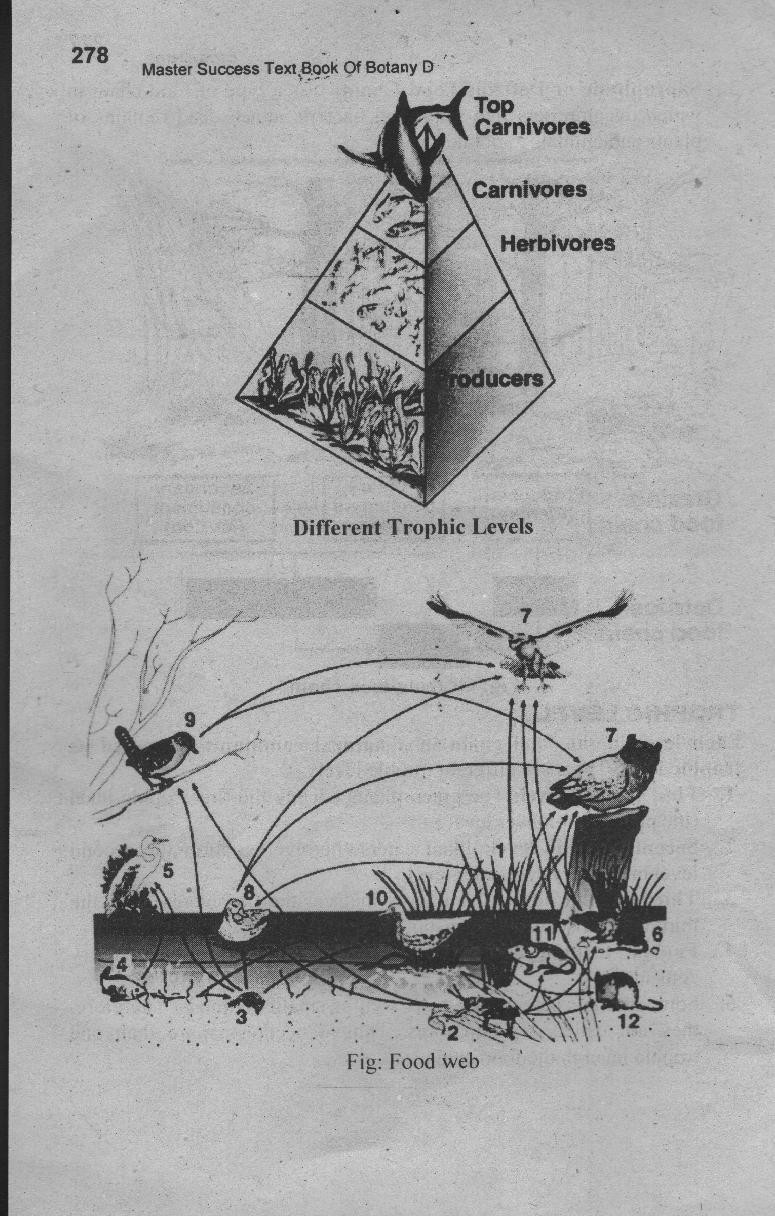
- FOOD WEBThe combination of different food chains is called food web. Food chain is a natural condition. It hardly occurs in the simplified linear arrangement. Different food chains are interconnected with each other. It forms alternatives source of food called food web. Food web forms an interlocking pattern with each other through different trophic levels. Food. webs are very important for maintaining the balance in nature. For example:
- In grazing food chain of grassland, grass may be eaten by muse. The mouse may be eaten directly by snake or hawk. The snake may also be eaten by hawk.
- Similarly, grass may also be eaten by grasshoppers. Grass hoppers are themselves eaten by frog and frogs are eaten by snakes.
Advantages of food web
There are varieties of pathways in a food web. These pathways maintain the stability of the ecosystem. For example, owls prey on rabbits and mice. If a disease reduces the rabbit population, a fewer plants are consumed. The larger plant population produces more fruits and seeds. Thus these plants support a larger mice population. The increased number of mice becomes the major food source for the owls. The rabbit population gradually increases, and these primary consumers again become a food source for the owls. Thus nature maintains a balance.
(c) Ecological Pyramids
The representations of flow of energy through an ecosystem in the form of pyramids are called ecological pyramids. Different types of ecosystem supports different types of food chains. Each food chain consists of all the three trophic levels. There is a proportionate relationship between the number, biomass (living weight) or amount of energy flow at each level of a food chain. All these kinds of relationship are represented in the form of pyramids Ecological pyramids are of the following types:
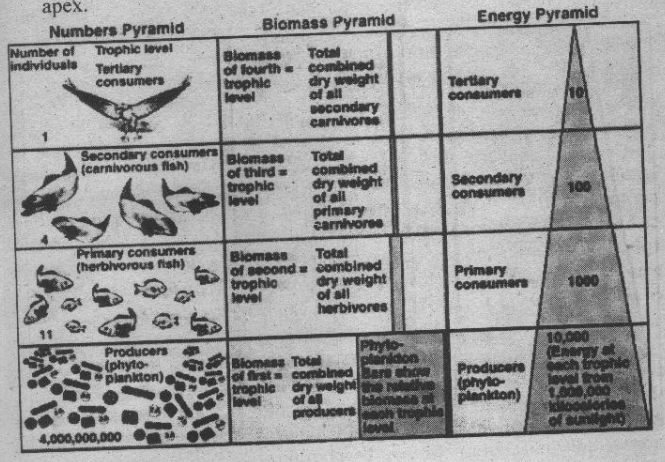
- Pyramid of Numbers
The pyramid Which shows the relationship between the number of producers, herbivores and carnivores at successive trophic levels is called pyramid of numbers. The number of individuals in each trophic level can be shown with the help of pyramid. The wide base of pyramid represents the producers. The plants are highest in number. The number of consumers of different types decreases further.
(a) Pyramids of the grassland: The number and species of producers like grasses, herbs and forbs are largest in number. Primary consumers or herbivores—like grasshopper, rabbit mice etc. They form the second largest number. But they are lesser than the producers. The snakes and lizards are lesser in. number than the primary consumer.
(b) Pyramids of forest or savanna ecosystem: The number of producers like herbs, shrubs and trees are in large number than the number of herbivores like deer, antelopes, elephants, zebra, giraffe. The number of carnivore like lion and tiger are far less in number as compared to the herbivore
(c) Pyramids of the aquatic, ecosystem: The base trophic level is occupied by large numb_et of producers called phytoplankton. These are algae, diatom and other hydrophytes. Second trophic level is occupied by lesser number of primary consumers or herbivores. It consists of zooplankton and smaller herbivorous fishes and rotifers. Secondary carnivores like ‘fishes eating each other. Finally the tertiary consumers comes which are in smaller numbers. Thus the number of organisms decreases from base of the pyramid to the apex.
-
- Pyramid of Biomass
The pyramid which shows the relationship between the biomass of producers, herbivores and cirnivores at successive trophic levels is called pyramid of biomass. The living weight of the organism is called biomass. The biomass of different trophic level also indicates the decrease of biomass in each trophic level from the base to the apex. In the terrestrial ecosystem total biomass of producers will be highest. But the biomass of the organism decreases from producers to the top carnivores.
-
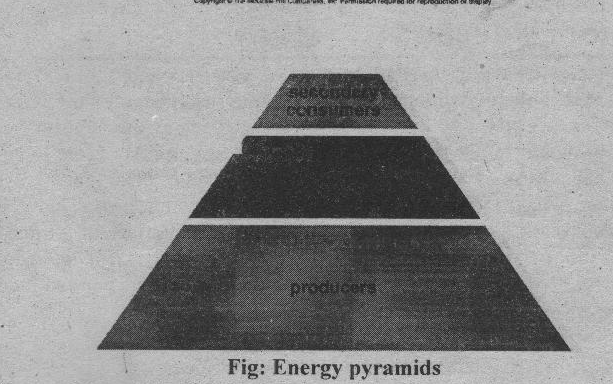
- Pyramid of Energy
The pyramid which shows the relationship between the energy successive trophic levels is called pyramid of energy. Solar energy is trapped by producers during photosynthesis. It is Converted into chemical energy. This energy flows in the food chain from the producers to the top carnivore. It decreases at successive trophic levels. This can be shown by the pyramid. The base of pyramid shows energy utilization at the producer level. The apex shows energy utilization by the top carnivores.
nice